LEARNING CENTER
Ten Reasons Why You Shouldn’t Buy Gold and Silver
What’s the Difference Between 24K and 9999 Gold?
The Gold American Eagle
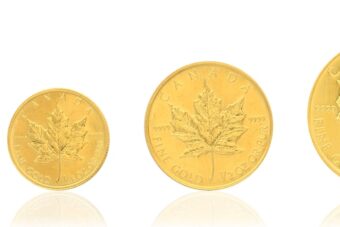
The Canadian Gold Maple Leaf
What’s the Difference Between 24K and 9999 Gold?
The Gold American Eagle
The Canadian Gold Maple Leaf
SEVERAL STATES ARE BEGINNING TO ACCEPT GOLD AND SILVER AS CASH
An encouraging victory for sound money has just taken place in West Virginia where they have now announced plans to remove taxation on precious metals as of July 1, 2019.
Louisiana, Utah, and Texas have passed legislation recognizing gold and silver as legal tender, a move that allows citizens to make transactions using precious metals in place of cash.
Joining seven other states that have either passed or introduced legislation in favor of the metals, Louisiana, Utah, and Texas are now taking further steps toward establishing regulatory depositories to hold gold and silver.
Now it’s up to the private sector to accept, re-introduce, and encourage the use of gold and silver as forms of payment. Once such transactions become commonplace, the ideal next step would be to enable citizens to use electronic payment systems, such as a debit card, to make transactions with the metals. Given enough time, these actions may eventually pave the way for other states to adopt gold and silver as legal tender, reinjecting sound money into the American economy.
Imagine a future where citizens can receive tax returns in the form gold and silver. If these current developments in favor of sound money are any indication at all, they suggest that such a future is not only becoming favorable among some states, but also quite achievable for the entire nation.
Below is a list of US states that accept Gold and Silver as legal tender:
Click on a state to see it's gold laws & regulations or to find local coin shops in your state

Coin Shops


