A Daily Journey Through the Week's Market
Monday - 5.19.25: Gold prices jumped Monday midday, with June gold up $45.70 to $3,233.80, while silver saw a modest gain, rising $0.191 to $32.535, as risk aversion grew following Moody’s downgrade of U.S. government debt and renewed global trade tensions. The downgrade, which lowered the U.S. credit rating to “Aa1” due to rising debt and fiscal deficits, added to market unease. Further pressure came after Treasury Secretary Bessent warned tariffs would revert to April 2 levels without good-faith negotiations, while weak Chinese trade data underscored the economic toll of the U.S.-China trade war.
Tuesday - 5.20.25: Gold and silver prices surged Tuesday midday, with June gold up $48.20 to $3,281.70 and July silver up $0.518 to $33.025, as safe-haven demand rose following Moody’s surprise downgrade of U.S. government debt. The downgrade reignited concerns over U.S. fiscal stability, pressuring stock indexes and boosting interest in gold and silver. However, this effect may fade quickly as market focus shifts to inflation and expectations that the Fed will hold rates steady, a scenario that could strengthen the dollar and weigh on precious metals.
Wednesday - 5.21..25: Gold and silver prices climbed at midday Wednesday, with June gold up $27.60 to $3,310.70 and July silver up $0.446 to $33.615, driven by safe-haven demand amid rising geopolitical tensions and strong Chinese buying. Reports that Israel may strike Iran’s nuclear facilities added to the bid, though markets remained relatively calm. Meanwhile, Chinese gold demand surged as April imports jumped 73% to an 11-month high, bolstered by central bank quotas, insurer buying, and retail demand amid concerns over the yuan and China’s property market.
Thursday - 5.22.25: Gold and silver prices dipped Thursday midday on profit-taking, but safe-haven demand remains strong as global bond markets tremble. A poorly received 20-year U.S. Treasury auction spooked investors, sending the 30-year yield above 5%—its highest since October 2023—and triggering a ripple of rising yields worldwide, including a record 30-year JGB yield. Markets are also uneasy about a Trump-backed tax and spending bill projected to add $3.8 trillion to the U.S. deficit by 2034.
Friday - 5.23.25: Gold prices rose sharply Friday morning on safe-haven demand ahead of the holiday weekend, while silver saw modest gains. Weaker stock market sentiment—sparked by President Trump’s social media threats of new tariffs on iPhones and the EU—helped fuel the move, with June gold last up $45.90 at $3,340.90 and July silver up $0.051 at $33.27.
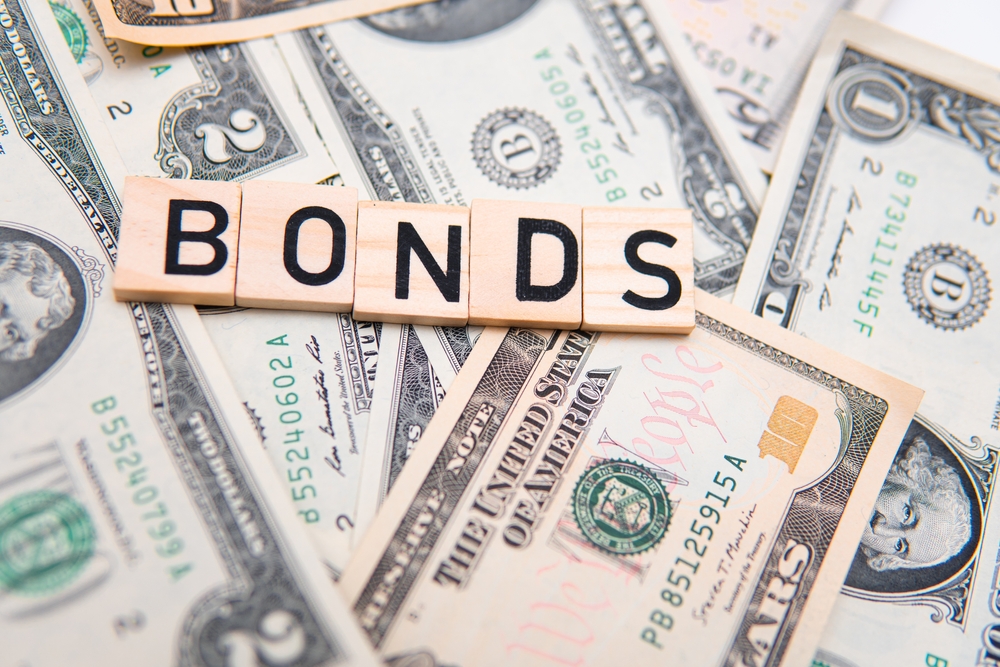
U.S. Treasury Yield Spike Has Investors Rethinking the Rest of the World
The Big Picture
Yields on long-dated U.S. Treasurys have surged past 5.1%, unsettling global investors and triggering comparisons to emerging market debt traps. As America's fiscal path grows murkier—with rising deficits, political gridlock, and a recent credit downgrade—investors are starting to question the risk profile of U.S. bonds and look elsewhere for stable, higher-yielding returns. The broader implication: trust in U.S. debt as a safe haven is eroding.
What’s Happening
A Treasury selloff has driven 20- and 30-year yields to fresh highs, reflecting investor anxiety over the U.S. fiscal outlook. Analysts point to a vicious cycle of higher rates leading to larger interest payments, which in turn deepen the debt burden. Half of all publicly held Treasurys—about $14 trillion—will soon need refinancing at these elevated rates. With Japanese yields rising and currency risks growing, institutional capital is beginning to repatriate. Global investors are diversifying into emerging market debt, where yields are stronger and exposure to U.S. fiscal risk is reduced.
By the Numbers
- 20-year U.S. Treasury yield: 5.136%
- 30-year U.S. Treasury yield: 5.128%
- U.S. federal debt maturing soon: $14 trillion
- Japan 30-year bond yield: 3.184% (record high)
- Japan 20-year bond yield: 2.598% (25-year high)
- Indonesia 10-year bond yield: ~7%
- China’s credit rating: A1 with stable outlook
Why It Matters
The U.S. may be facing what some call an “emerging markets trap”—spiraling debt, rising yields, and eroding investor confidence. With global capital flowing out of the U.S. and into countries offering higher returns without currency exposure, the American economy faces multiple risks: higher borrowing costs, weakening demand for Treasurys, and further dollar devaluation. These forces could compound inflationary pressures and undermine the Fed’s ability to stabilize markets without reigniting QE or other crisis-era tools.
The Bottom Line
The world’s most trusted debt instrument is being reevaluated. As Treasury yields spike and investor capital searches for safer, more rewarding homes, the U.S. risks losing its status as the global anchor for fixed income. For now, America remains liquid—but no longer unquestioned. The era of effortless borrowing may be coming to an end.
$100 Silver? $4,500 Gold? Analyst Says This Bull Market Is Just Getting Started
The Big Picture
Despite gold’s recent highs, technical analyst Jordan Roy-Byrne argues that the real rally is only beginning. A breakout from a 13-year cup-and-handle pattern confirms the start of a new secular bull market for both gold and silver. Coupled with deteriorating credit markets and inflationary pressures, Roy-Byrne sees historical parallels that suggest massive upside—potentially pushing gold to $4,500 and silver past $100.
What’s Happening
Gold’s breakout in March 2024 has been backed by major macro shifts: Treasury yields are rising, bonds are entering a secular bear market, and credit quality is collapsing. Moody’s recently downgraded the U.S. credit rating, and JPMorgan’s Jamie Dimon warned of growing financial risk due to underestimated stagflation and geopolitical instability. Gold has already outperformed both the S&P 500 and the traditional 60/40 portfolio. Silver, still lagging, is building momentum toward a breakout of its own.
By the Numbers
- Gold target (12 months): $4,400–$4,500
- Gold target (year-end): $3,700
- Silver breakout level: $35–$37
- Silver surge target: $100 in 12–15 months
- Historical pattern: 45-year base for both metals
- Key technical event: 13-year cup-and-handle breakout (March 2024)
Why It Matters
The technical and macro alignment mirrors conditions seen before explosive rallies in 1930, 1972, and 2002. Roy-Byrne believes that both metals are launching from a long-term base—suggesting this is not a top, but a beginning. Meanwhile, undervalued gold miners are positioned for outsized gains, providing additional leverage for investors seeking to maximize returns during this phase.
The Bottom Line
This isn’t just a rally—it’s a structural breakout. With macro headwinds intensifying and historic patterns aligning, both gold and silver could be entering their most powerful bull run in decades. For investors, the time to prepare isn’t after the breakout—it’s now.
Japan’s Portfolio Reshuffle Raises Red Flag for the U.S.
The Big Picture
Japan, long a dependable financier of U.S. debt, may be rethinking its role. A shift in strategy among Japan’s biggest institutional investors—pensions and insurers—signals a retreat from foreign bond markets just as the U.S. faces rising deficits, a downgraded credit rating, and renewed fears of dollar depreciation. This behavioral change, driven by rising yields and currency hedging costs, could inject fresh volatility into global debt markets and undermine demand for U.S. Treasuries.
What’s Happening
A weak 20-year Japanese government bond auction sent yields on 30- and 40-year JGBs surging to multi-decade highs, while shorter maturities remained calm. Analysts suggest Japan’s institutional investors are shifting strategy as the Bank of Japan exits its ultra-loose policy. Societe Generale notes that life insurers have become net sellers of long-duration debt and are increasingly pulling back from foreign bonds due to unfavorable currency hedging costs. Their retreat raises concerns for U.S. Treasury markets, where Japanese investors remain the top foreign holders.
By the Numbers
- Japan's debt-to-GDP: 260% (highest among major economies)
- Japanese foreign bond holdings (2023): $2.3 trillion
- U.S. Treasuries held by Japan: $1.13 trillion
- Recent net sales by Japanese investors: $45 billion in European bonds
- Ultra-long JGB yield jump: +15–20 basis points
- U.S. Treasury market size: $28.6 trillion
Why It Matters
Even marginal pullbacks from major creditors like Japan can ripple through the Treasury market at a time of structural U.S. fiscal vulnerability. With higher hedging costs and geopolitical friction—including speculation around the dollar in trade negotiations—Japan’s pivot could not only pressure the yen upward but also raise global borrowing costs. A less supportive Japan complicates the U.S. debt outlook, especially as markets reassess risk and inflation.
The Bottom Line
Japan may no longer be the quiet pillar of the U.S. bond market. As its institutional giants rebalance toward domestic assets, American debt faces one less buyer at a time when deficits are exploding. In today’s fragile environment, even a marginal retreat could shake confidence—and leave Washington asking who’s left to pick up the tab.
China Gold Demand Surges as Beijing Uses Bullion to Fuel De-Dollarization
The Big Picture
Gold prices are being bolstered by a renewed wave of Chinese demand, with investors, institutions, and the central bank ramping up bullion purchases. This surge in imports not only supports market stability but also reflects China’s deeper strategic pivot away from the U.S. dollar, reinforcing gold’s role in global financial realignment.
What’s Happening
China imported 127.5 metric tons of gold last month—an 11-month high and a 73% jump from March—despite gold prices hitting record highs. The People’s Bank of China expanded import quotas, responding to intense demand amid U.S.-China trade tensions. Even after an 8% pullback from all-time highs, Chinese traders held their positions, showing conviction over speculation. Analysts say China’s retail and institutional appetite for gold is also about long-term monetary autonomy, as it builds a parallel system anchored in bullion and the yuan.
By the Numbers
- Gold imports (April): 127.5 metric tons
- Increase from March: +73%
- Spot gold: Over $3,300/oz
- Shanghai open interest: All-time highs
- 6-month implied volatility: ~19.5%
- Gold price (April high): $3,500/oz
Why It Matters
China’s gold strategy is both economic and geopolitical. Massive, ongoing gold accumulation—potentially far higher than official disclosures—reduces dependence on dollar-denominated assets while asserting greater financial sovereignty. Combined with the gradual internationalization of the yuan, Beijing is laying the groundwork for a more multipolar monetary system.
The Bottom Line
China isn’t just buying gold—it’s building leverage. With its methodical accumulation of bullion and rising use of the yuan in trade, Beijing is quietly rebalancing the global financial order. For gold, that means sustained demand from one of the world’s largest economies—and potentially, a powerful long-term tailwind.
Next Week’s Key Events
Economic Calendar: May 26 – May 30, 2025
Monday, May 26
- None scheduled — Memorial Day holiday
Tuesday, May 27
- 9:00 AM ET: S&P CoreLogic Case-Shiller Home Price Index – March
Tracks changes in the value of residential real estate in major metropolitan areas. - 10:00 AM ET: Consumer Confidence – May
Measures consumer optimism regarding the economy, spending, and job prospects.
Wednesday, May 28
- 2:00 PM ET: FOMC Meeting Minutes – May
Detailed record of the Fed's May policy meeting; may reveal new clues on future rate paths.
Thursday, May 29
- 8:30 AM ET: Initial Jobless Claims – Week Ending May 24
Weekly measure of new unemployment claims; a leading indicator of labor market health. - 8:30 AM ET: GDP (First Revision) – Q1
Updated estimate of Q1 economic growth, incorporating more complete data. - 10:00 AM ET: Pending Home Sales – April
Tracks contracts to buy previously owned homes; a forward-looking housing indicator.
Friday, May 30
- 8:30 AM ET: PCE Index – April
The Fed’s preferred inflation gauge, measuring changes in consumer spending prices. - 10:00 AM ET: Consumer Sentiment (Final) – May
Final reading of consumer outlook on personal finances and economic conditions.
IMPACT ON PRECIOUS METALS MARKETS
Consumer Confidence & Sentiment (May 27, 30):
High confidence may signal resilient spending and tighter Fed policy—bearish for gold. Weak readings could support safe-haven buying.
FOMC Minutes (May 28):
Any hint of rate hikes or hawkish bias could weigh on gold. Dovish language would be bullish for precious metals.
Initial Jobless Claims (May 29):
Rising claims signal labor softening—bullish for gold. Falling claims support economic strength and possible tightening—bearish for metals.
GDP Revision (May 29):
Stronger GDP may reinforce rate hike expectations—negative for gold. Downward revisions may lift safe-haven demand.
PCE Index (May 30):
A higher-than-expected inflation reading could push yields up—potentially bearish for metals. Cooler inflation may boost gold on hopes of Fed easing.
Housing Data (May 27, 29):
Sluggish price growth or pending sales may indicate cooling—supportive of gold. Hot housing data could point to economic strength—bearish bias for metals.


